Evidence for progress: Global poverty rates
Contrary to the expectations of the skeptics of progress, poverty rates are falling across the world.
Human material progress is a fact. It can be seen in metrics of economic growth, human development, freedom, slavery, poverty, agricultural production, literacy, diet, famines, sanitation, drinking water, life expectancy, neonatal mortality, disease, education, access to electricity, housing, violence (to name just a few), and in virtually every nation.
In this post, I go into more detail on just one of these metrics.
Absolute Poverty
In previous excerpts, I showed how there has been tremendous material progress as measured by per capita GDP or the United Nations Human Development Index. Of course, the poor may have missed out on this economic growth. Perhaps the rich have monopolized all the economic gains. So we must go beyond national economic growth to see if the bottom of the economic scale enjoyed the benefits of economic growth.
The following is an excerpt from my book From Poverty to Progress: Understanding Humanity’s Greatest Achievement. You can purchase discounted copies of my book at my website, or pay full prize at Amazon.
See more articles on Evidence for Progress:
Book review: "Ten Global Trends Every Smart Person Should Know" by Bailey & Tupy
Long-term trends in per capita GDP (article; podcast; video)
Growth in per capita GDP (2012-2022) (article; podcast; video)
United Nations Human Development Index (article; podcast; video)
Does material progress lead to happiness? (article; podcast; video)
more.
First, let’s look at the trends for absolute poverty from 1800 to today. Absolute poverty measures the percentage of people who live on $1.90/day or less (this amount is adjusted for inflation and cost-of-living). $1.90/day is a level of poverty that is almost impossible to imagine for a modern-day citizen of a Western nation. Sadly, it is roughly the standard of living that the vast majority of humans have had for most of history.
In 1800 89.7% of the world’s population lived in a state of absolute poverty. The lucky people who lived above this pathetic level of existence were overwhelmingly concentrated in Northwest Europe and the United States. Even as late as 1970 a majority of the people on planet Earth lived on less than $693/year.
The drop in absolute poverty over the last 30 years has been nothing short of revolutionary. Poverty rates have dropped from 40.2% to 10.1% – a quarter of their previous level. Within a little over 200 years, the world transformed from virtually all people living in absolute poverty to very few of them doing so.
In East Asia, the progress in reducing absolute poverty has been nothing short of astounding. Today we forget just how poor East Asia was only a few generations ago. Most East Asians in 1970 had much the same standard of living as they had had 2,000 years previously.
In 1970 East Asia had levels of absolute poverty rates that were roughly the same as Sub-Saharan Africa at the time. By 2006, the absolute poverty rate in East Asia had dropped to 1.7%! In less than two generations East Asia had virtually eliminated absolute poverty.
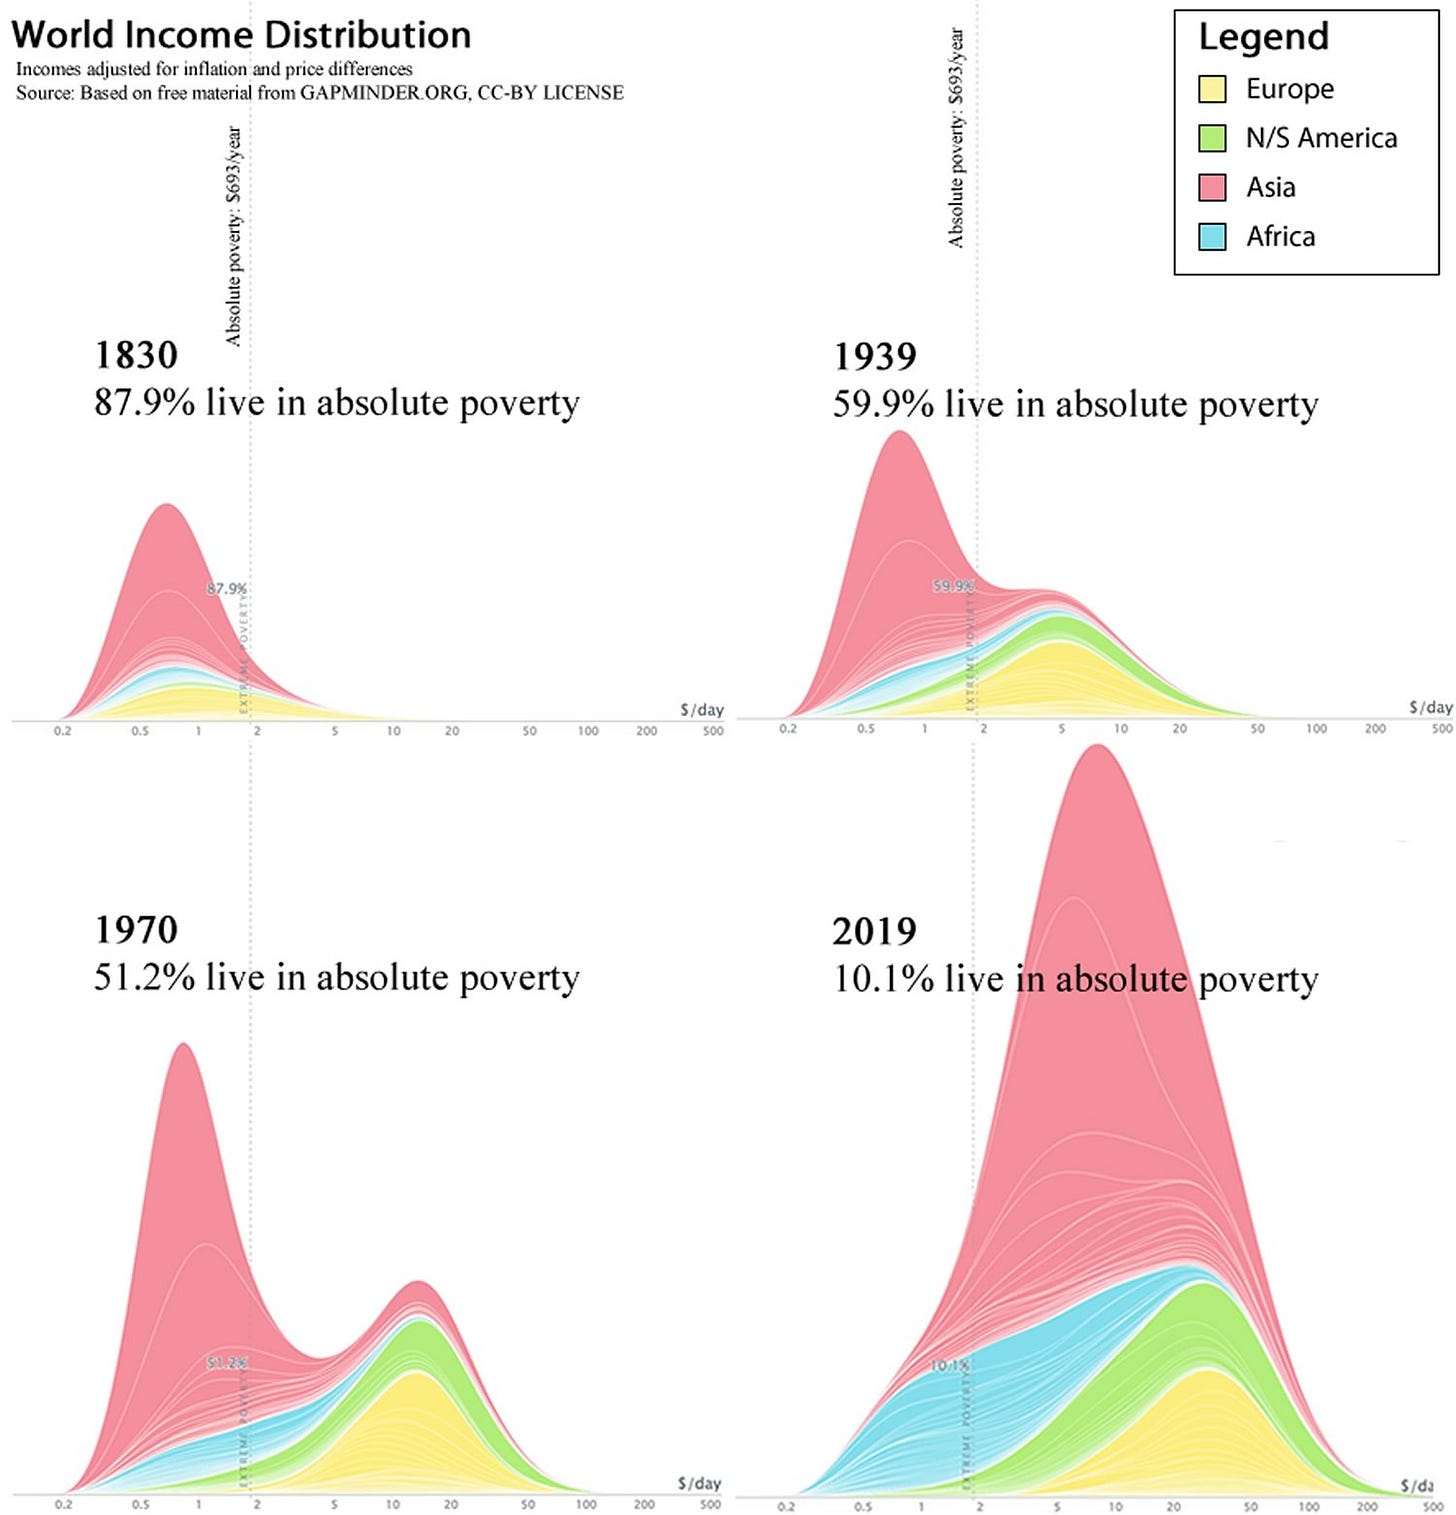
If we look at the overall distribution of world income, the changes are just as clear. In 1830 virtually the entire world lived below the absolute poverty line. By 1939 Europe and North America had grown far richer, but the rest of the world was still trapped in poverty.
By 1970 we lived in a bifurcated world: a wealthy First World consisting of Europe, North America and Japan, and a desperately poor Third World. The First World was rich, the Third World was poor, and few people were in between. Today many people believe that we still live in that world.
By 2020, though, rapid economic growth had transformed the Third World so that many parts of it began to resemble the First World. Today, absolute poverty is rare. Most of the people who Westerners perceive as poor in other nations are middle income. And more poor people move up to middle-income status virtually every year.
Even if there had been no other positive trend over the last 50 years, it would be hard not to consider this proof enough of progress during our time. Of course, global trends can cover up national counter-trends, so we must dig deeper into the data.
Poverty Rates by Nation
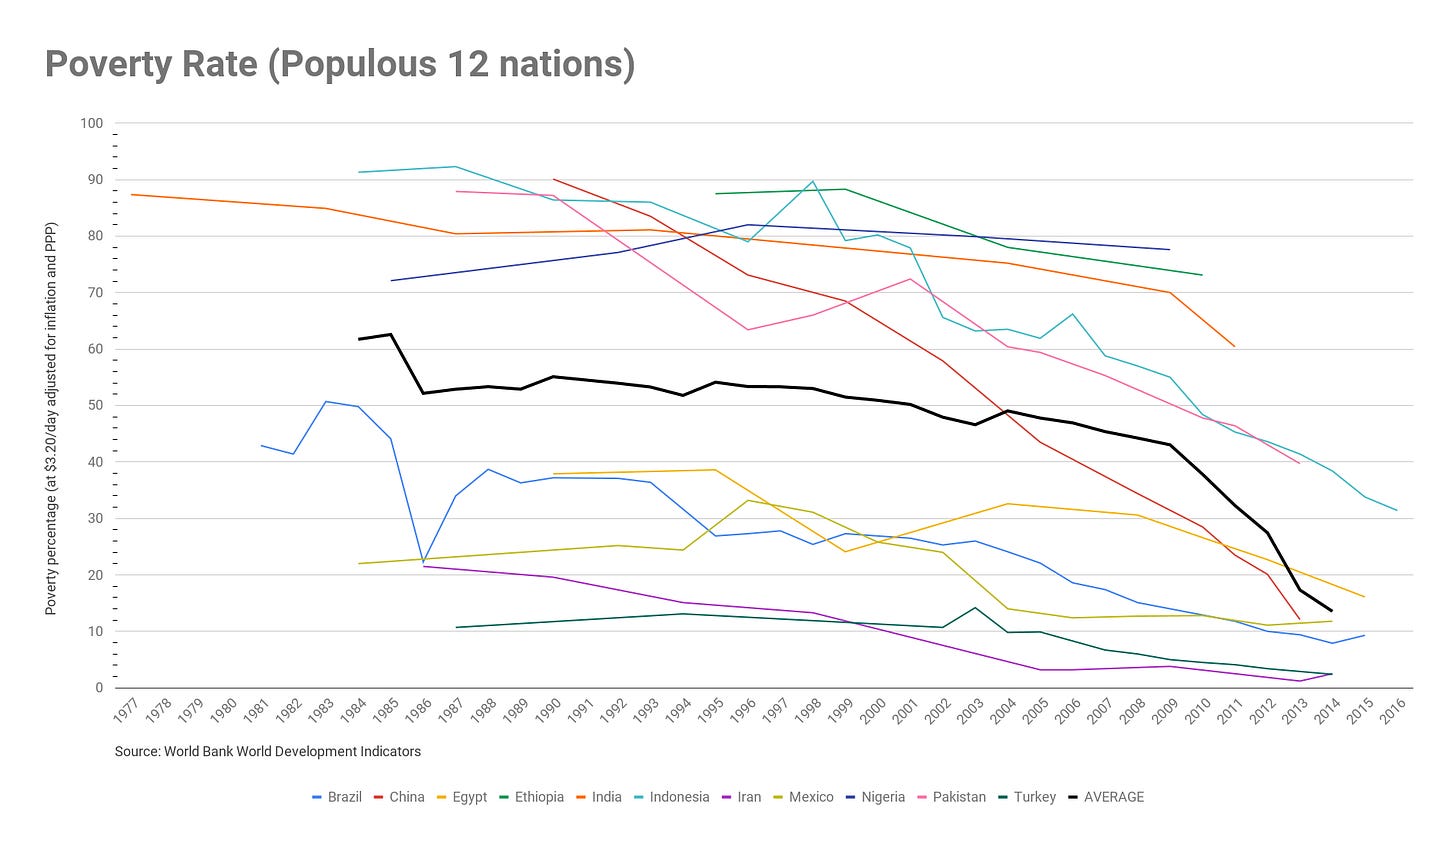
Another means for measuring progress in reducing poverty is the Poverty Headcount Ratio at $3.20/day. This metric measures the percentage of the total population in each nation that earns under $3.20/day or $1168/year. This amount is indexed for inflation and cost-of-living to make the comparison between nations and over time legitimate, so all values are given in today’s values.
Since there are over 200 nations today, it is not realistic to examine development metrics for every one of them in this book. And averages can cover up variations between rich and poor nations. We need a way to narrow the sample to a manageable number, but not in a way that creates a distorted impression of overall trends. In order to ensure that the data covers a very broad segment of the world’s population, I decided to focus on four distinct categories of nations.
The first group, which I will call the “Wealthy 12”, consists of 12 Western nations that industrialized early and currently have very high standards of living. Those nations are the United States, United Kingdom, Australia, Belgium, Canada, France, Germany, Netherlands, New Zealand, Norway, Sweden, and Switzerland. The Wealthy 12 gives us a good overview of the trends within the wealthiest nations.
For the Wealthy 12, the number of poor by this measure is so low as to make the measurement meaningless.
The second group that I will show data for is what I call the “Populous 12”. This group consists of 12 of the most populous nations that did not have high per capita GDP in 2020. This group consists of China, India, Brazil, Congo, Egypt, Ethiopia, Indonesia, Iran, Mexico, Nigeria, Pakistan, and Turkey. Together these nations make up 58% of the world’s population and cover every continent except Australia and Antarctica. The Populous 12 gives us a broad overview of trends for people who live outside the wealthiest nations.
Among the Populous 12, the average poverty rate declined dramatically from 62% in 1984 to 14% in 2014 – a quarter of its previous level. China reduced poverty from 90% in 1990 to 7%. Indonesia reduced poverty from 92% to 27%. Mexico’s figure dropped from 23% to 11%. Bangladesh, Pakistan and Turkey all made substantial progress by this measurement. Of the populous low-income nations, only Nigeria failed to make real progress (although the data is very sparse for this nation).
The third group is what I call the “Bottom 20”. This group consists of the 20 nations with the lowest scores on the United Nations Human Development Index in 1990 (the earliest year available). The nations in this group consist of Afghanistan, Benin, Burma, Burundi, Central African Republic, Congo, Gambia, Guinea, Malawi, Mali, Mauritania, Mozambique, Niger, Papua New Guinea, Rwanda, Senegal, Sierra Leone, Sudan, Tanzania and Uganda. The Bottom 20 gives us a good overview in trends of the most desperately poor nations in the world. If there is any group of nations that should lack evidence of progress, it is these 20 nations.
For the Bottom 20, the data is also encouraging. The average declined from 83% in 1989 to 71% in 2013. Most nations have made substantial progress, with Mauritania (from 66% to 24%) and Gambia (from 87% to 38%) showing the most impressive results. The only country where the level increased was in Malawi, but some others showed only slow progress: Congo, Burundi, Papua New Guinea and Senegal.
Part of the problem is that these nations started out so poor that this metric misses some important progress. When we use $1.90/day instead, the progress is more evident in the Bottom 20. Using this metric, every nation within the Bottom 20 shows real progress, with Rwanda being the exception (dropping from 61% to 56%).
Of course, it is hard to miss the fact that poverty in the Bottom 20 is still at appalling levels and far more progress needs to be made. Given the trends over the past 30 years, however, there is reason to be optimistic about continued progress in the future.
The last group of nations is what I call the “Transformative 16”. This group consists of nations that experienced at least one generation of very strong economic growth after 1950 (or 20+ years of per capita GDP growth of over 3 percent). This level of economic growth would lead to a doubling of the standard of living of their people within one generation.
The Transformative 16 includes representatives from many different regions and cultures: Spain, Ireland, Japan, Hong Kong, Taiwan, Thailand, Singapore, South Korea, Indonesia, China, India, Israel, Botswana, Trinidad, Puerto Rico and Chile. The Transformative 16 gives us a good overview of the nations that experienced the fastest economic growth. It tests whether very rapid economic growth translates into positive changes throughout society.
The Transformative 16 experienced very significant declines in poverty. The average dropped from 47% in 1987 to 11% in 2014 – less than a quarter of its previous level. Except for Spain and Ireland who already had very low rates of poverty by this measure, and Trinidad for which we have little data, all the nations had very large drops. Chile and Thailand virtually eliminated poverty, while China, India and Indonesia saw dramatic drops. By 2017, only India still had a significant problem with poverty although the levels were dropping fast.
With all of these graphs, there is a clear trend towards declining levels of absolute poverty. In some nations, the decline was truly transformational. With the partial exception of Malawi, the downtrend is seen in all nations, even the poorest.
Other metrics of progress
The metric used in this post is not the only evidence of progress. You can also find evidence for progress in the metrics of economic growth, human development, freedom, slavery, poverty, agricultural production, literacy, diet, famines, sanitation, drinking water, life expectancy, neonatal mortality, disease, education, access to electricity, housing, violence, and happiness (to name just a few), and in virtually every nation. You can find many more in my first book.
Stay tuned for more excerpts…
The above is an excerpt from my book From Poverty to Progress: Understanding Humanity’s Greatest Achievement. You can purchase discounted copies of my book at my website, or pay full prize at Amazon.
See more articles on Evidence for Progress:
Book review: "Ten Global Trends Every Smart Person Should Know" by Bailey & Tupy
Long-term trends in per capita GDP (article; podcast; video)
Growth in per capita GDP (2012-2022) (article; podcast; video)
United Nations Human Development Index (article; podcast; video)
Does material progress lead to happiness? (article; podcast; video)
more.


