Evidence for progress: UN Human Development Index
The UN HDI, the most widely-used metric from measuring progress in developing countries shows remarkable progress since 1990.
UN Human Development Index
Robust levels of economic growth and dramatic declines in poverty are not enough to prove that progress exists. We also need to look at broader indexes of material standards of living.
The Human Development Index (HDI), which was created by the United Nations, combines several development metrics into one index. It is now the most widely used index for measuring material standard of living. The components of HDI are life expectancy at birth, expected years at school, mean years of schooling and Gross National Income per capita (adjusted for purchasing power). The index ranges from 1.00 (the highest possible score) to 0.00 (the lowest possible score).
HDI gives us reliable data for measuring progress from 1990 to the present. In 2018, the index values range from first-placed Norway at 0.954 to 189th- place Niger at 0.377. For comparison purposes, the United States and the United Kingdom are tied for 15th at 0.92.
The Human Development Index overwhelmingly confirms the fact that there has been widespread progress throughout the world for the last 30 years. Between 1990 and 2018, the World’s HDI improved from 0.598 to 0.731 (a 22.2% improvement).
Since there are over 200 nations today, it is not realistic to examine development metrics for every one of them in this book. And averages can cover up variations between rich and poor nations. We need a way to narrow the sample to a manageable number, but not in a way that creates a distorted impression of overall trends. In order to ensure that the data covers a very broad segment of the world’s population, I decided to focus on four distinct categories of nations.
The following is an excerpt from my book From Poverty to Progress: Understanding Humanity’s Greatest Achievement. You can purchase discounted copies of my book at my website, or pay full prize at Amazon.
See more articles on Evidence for Progress:
Book review: "Ten Global Trends Every Smart Person Should Know" by Bailey & Tupy
Long-term trends in per capita GDP (article; podcast; video)
Growth in per capita GDP (2012-2022) (article; podcast; video)
United Nations Human Development Index (article; podcast; video)
Does material progress lead to happiness? (article; podcast; video)
more.
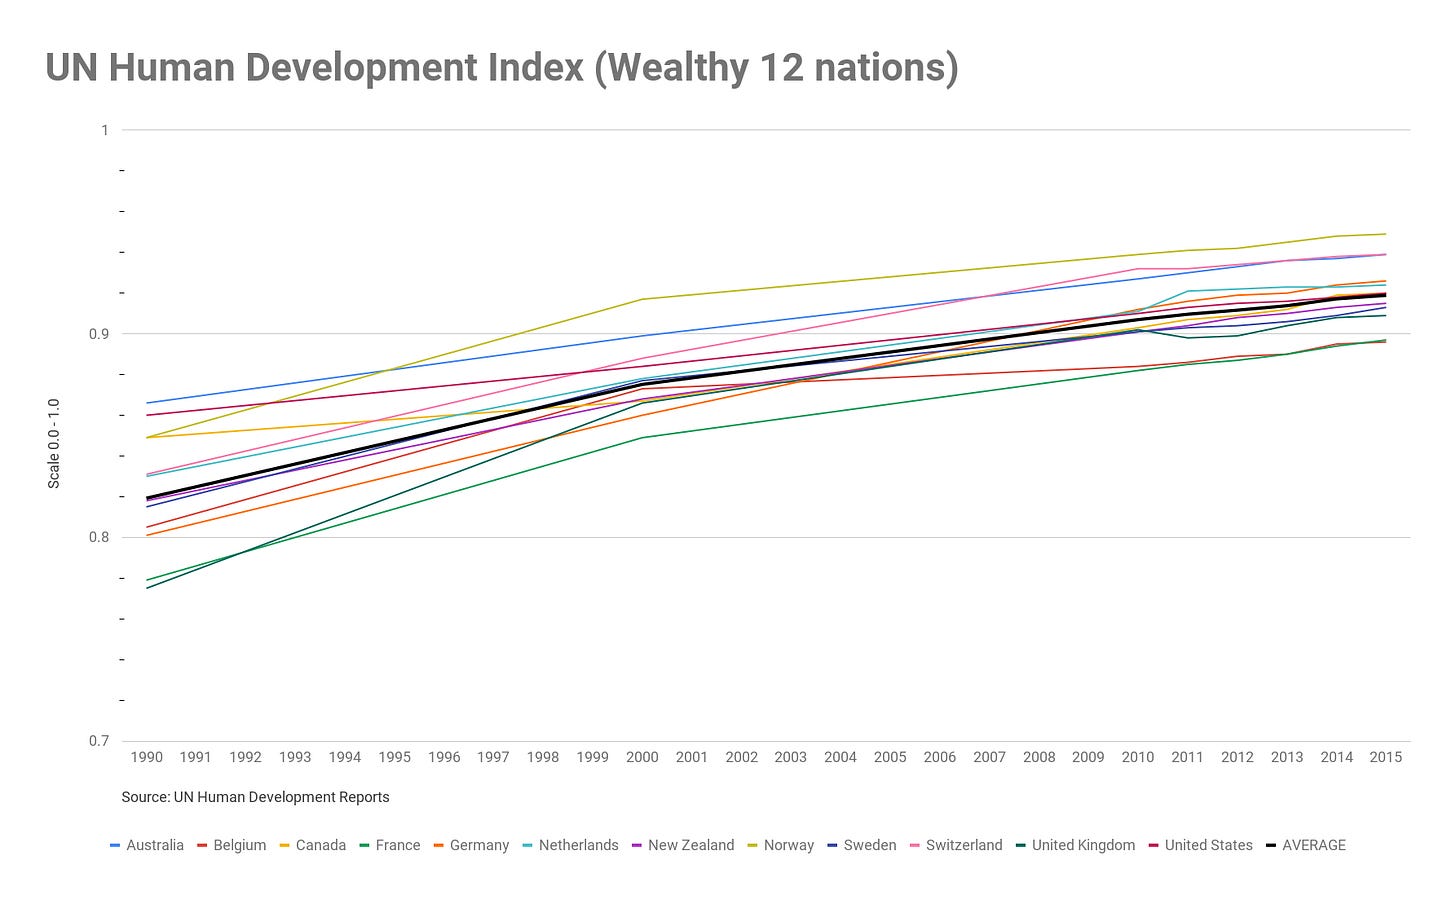
The first group, which I will call the “Wealthy 12”, consists of 12 Western nations that industrialized early and currently have very high standards of living. Those nations are the United States, United Kingdom, Australia, Belgium, Canada, France, Germany, Netherlands, New Zealand, Norway, Sweden, and Switzerland. The Wealthy 12 gives us a good overview of the trends within the wealthiest nations.
For the Wealthy 12, every nation improved its HDI over the last 30 years. The United States (+7%), Canada (+9%) and Australia (+8%) showed the least progress, while the UK (+19%) and Germany (+17%) showed the most progress. It is important to note that the score for every one of the Wealthy 12 improved by less than the world average.
The second group that I will show data for is what I call the “Populous 12”. This group consists of 12 of the most populous nations that did not have high per capita GDP in 2020. This group consists of China, India, Brazil, Congo, Egypt, Ethiopia, Indonesia, Iran, Mexico, Nigeria, Pakistan, and Turkey. Together these nations make up 58% of the world’s population and cover every continent except Australia and Antarctica. The Populous 12 gives us a broad overview of trends for people who live outside the wealthiest nations.
For the Populous 12, every nation improved its HDI over the last 30 years. Even the nations that improved the least still made a substantial improvement: Mexico (+18%), Congo (+22%) and Brazil (+24%). Except for Congo, these were the wealthiest nations within this group in 1990. The most impressive improvements were made in China (+51%) and India (+50%). As is common with many of the metrics in this book, the two most populous nations in the world have been setting the pace for progress over the last 30 years.
The third group is what I call the “Bottom 20”. This group consists of the 20 nations with the lowest scores on the United Nations Human Development Index in 1990 (the earliest year available). The nations in this group consist of Afghanistan, Benin, Burma, Burundi, Central African Republic, Congo, Gambia, Guinea, Malawi, Mali, Mauritania, Mozambique, Niger, Papua New Guinea, Rwanda, Senegal, Sierra Leone, Sudan, Tanzania and Uganda. The Bottom 20 gives us a good overview in trends of the most desperately poor nations in the world. If there is any group of nations that should lack evidence of progress, it is these 20 nations.
For the Bottom 20, every nation improved their HDI over the last 30 years, and all but Congo (+22%) and Central African Republic (+19%) improved more than the global average. And those two countries showed improvements that were only slightly below average. Indeed, only 6 of the Bottom 20 nations in 1990 failed to double the world average for improvement (+22%). Many of the nations that were frightfully underdeveloped in 1990 showed spectacular progress: Niger (+78%), Mozambique (+106%), Mali (+85%), and Rwanda (+119%).
The last group of nations is what I call the “Transformative 16”. This group consists of nations that experienced at least one generation of very strong economic growth after 1950 (or 20+ years of per capita GDP growth of over 3 percent). This level of economic growth would lead to a doubling of the standard of living of their people within one generation.
The Transformative 16 includes representatives from many different regions and cultures: Spain, Ireland, Japan, Hong Kong, Taiwan, Thailand, Singapore, South Korea, Indonesia, China, India, Israel, Botswana, Trinidad, Puerto Rico and Chile. The Transformative 16 gives us a good overview of the nations that experienced the fastest economic growth. It tests whether very rapid economic growth translates into positive changes throughout society.
The Transformative 16 all showed substantial improvements in HDI from 1990 to the present. India had the lowest level (0.427) in 1990. By 2017, India had increased by 50% to 0.64. Seven of the Transformative 16 had HDI in 2017 that met or exceeded the levels of the Wealthy 12 in 1990.
Because of the comprehensive nature of the HDI data, we can investigate in greater detail than for other metrics. Every single geographical region showed significant improvement. The slowest improvements were in Europe and Central Asia (19%), while the largest improvements were in South Asia (46%).
Most importantly, the poorest nations showed the most improvement. Very High Human Development countries (mainly in Europe and North America) improved only 15%, and OECD nations improved a similar 14%. Both of these figures, while better than in 1990, are far below the improvement in the rest of the world.
By comparison, Sub-Saharan Africa improved by 35%, Low Human Development nations improved by 44%, and the Least Developed Countries improved by 51%. These are all astounding improvements for regions that saw no evidence of progress for thousands of years!
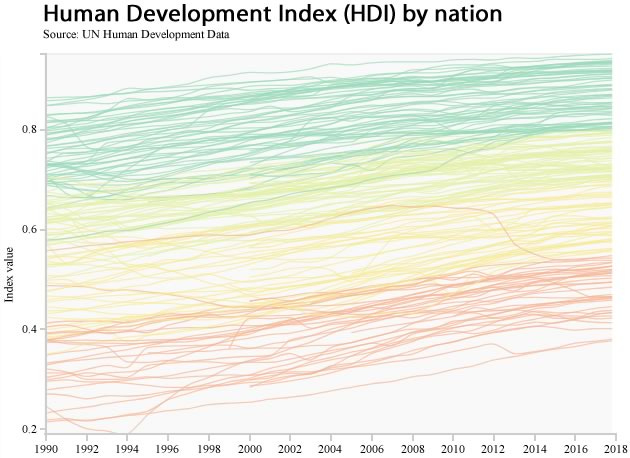
If we look at how individual nations progressed in comparison to each other, the entire world seems to be progressing. In the graphic above nations are color-coded by which quartile (25%) they belonged to in 2018. The nations with dark green lines are in the top quarter in 2018, while the nations in orange lines were in the bottom quarter in 2018. The light green and yellow lines are the middle quarters.
Viewing this graphic, it is obvious that virtually all nations improved their HDI index between 1990 and 2018. Just as importantly, if one inspects the colors carefully, one can see that the nations remained in roughly the same order. It is as if all nations are going up an escalator with the highest HDI nations getting on first and the lowest HDI nations getting on last. All nations are going up, but some nations got a head start. Most importantly, the destinations are the same: a significant improvement in HDI scores.
There are some exceptions. Syria started in the middle (0.59) in 1990, but then started to drop dramatically in 2012 when their civil war started. Lesotho also dropped substantially until 2006 before improving again. Turkey dramatically improved. Despite these exceptions, there is a remarkable similarity in the improvement for all nations between 1990 and 2018. The poorer nations are closing the gap, but rarely surpassing richer nations in rank.
When the focus shifts to individual nations, the trend is even more apparent. Of the 145 nations with complete data since 1990, all but one improved (Civil War-torn Syria had a decline of 1.6%). And even Syria showed clear improvement from 1990 until 2009, just before the violence started.
If we compare where nations started in 1990 and how much they improved over the next 30 years, it is clear that the poorest nations prospered the most. Among the 20 nations that improved the least in the last 30 years, only four (Syria, Ukraine, Namibia, and tiny Eswatini) were below the world average (0.598) in 1990. None of the 20 nations who improved the most was already above the world average in 1990.
And the pattern remains the same if we restrict our view to the most populous nations. All of the most populous nations with below-average levels of development in 1990 improved more than the world average: China (51%), India (50%), Pakistan (39%), Indonesia (35%), and Bangladesh (58%).
Of course, there are laggard nations, but the number of them is surprisingly small. Only 12 of 145 nations were below average in levels of development in 1990 and improved at a rate that was lower than the world average.
While there has been clear progress for almost all nations since 1990, it is important to note that very few nations jumped up or fell back very far in rank by 2018. Among the top 40 in 1990, only two nations (Brunei #42 and Barbados #50) dropped out of that category. Among the bottom 40 in 1990, only four moved up out of the category, with Rwanda, which moved up to #122 being the biggest jump.
Only six nations (Turkey, Iran, China, Singapore, Thailand and Ireland) moved up more than twenty spots between 1990 and 2018. Turkey’s move of 33 spots from #86 to #53 was the largest jump.
Alternatively, only eight nations (Libya, Ukraine, Moldova, Syria, Tonga, Kyrgyzstan, Lesotho and Tajikistan) fell more than 20 spots between 1990 and 2018. Not surprisingly, many of these nations have been rocked by civil wars or political turmoil during this period.
Far more typical are the 89 of 145 nations that were within ten spots of their 1990 ranking in 2018. Based on the HDI Index, one of the best measurements of progress available, almost all nations experienced progress but there were relatively small differences in their rankings in 2018 compared to their ranking in 1990.
It should also be noted that the top of the list is just as heavily weighted towards Europe and nations settled by Europeans in 2018 as it was in 1990. While Ireland and Singapore entered the Top 20 by 2019 and the UK and Liechtenstein dropped out, the Top 20 in 1990 was quite similar to the Top 20 in 2018. What had happened is that the rest of the world has narrowed the gap considerably.
Based on all the above, it is very clear that human material progress since 1990 has:
Benefitted virtually every nation in the world.
Has disproportionately benefitted the nations that were the poorest in the world in 1990.
Can be disrupted, although presumably temporarily, by wide-spread civil war.
It is also notable that while poorer nations have shown striking progress, they seldom surpass rich nations. Poor nations have instead narrowed the gap between themselves and rich nations.
Other metrics of progress
The metric used in this post is not the only evidence of progress. You can also find evidence for progress in the metrics of economic growth, human development, freedom, slavery, poverty, agricultural production, literacy, diet, famines, sanitation, drinking water, life expectancy, neonatal mortality, disease, education, access to electricity, housing, violence, and happiness (to name just a few), and in virtually every nation. You can find many more in my first book.
Stay tuned for more excerpts…
The above is an excerpt from my book From Poverty to Progress: Understanding Humanity’s Greatest Achievement. You can purchase discounted copies of my book at my website, or pay full prize at Amazon.
See more articles on Evidence for Progress:
Book review: "Ten Global Trends Every Smart Person Should Know" by Bailey & Tupy
Long-term trends in per capita GDP (article; podcast; video)
Growth in per capita GDP (2012-2022) (article; podcast; video)
United Nations Human Development Index (article; podcast; video)
Does material progress lead to happiness? (article; podcast; video)
more.


Imo we shouldn't putting years of schooling in the HDI because schooling is a means to an end and not an end on to itself. We should replace education related HDI data with Pisa scores or some other standardised test scores.
It's almost like neoliberalism works.